Working with proteomics data in R
Proteomics in Biomedicine
Gorka Prieto <gorka.prieto@ehu.eus>
University of the Basque Country (UPV/EHU)
September 29, 2025
First of all …
- Click the following link to start downloading a file (15 minutes) we will need:
- Already downloaded at
C:\Usuarios\Acceso Publico\Documentos Publicos
1 Goal
- Understand the steps and data structures of a shotgun proteomics bioinformatics workflow:
- After the search engine (already covered in previous sessions)
- In a practical way with a computer
- Using free/open-source solutions instead of “black box” software:
- R notebooks

2 R notebooks
2.1 What’s R? Why to use it?
- R is a programming language designed for statistical computing and graphics
- Free software and open-source (GPL license)
- Thousands of bioinformatic packages available (see Bioconductor repository) with active contributions and support
- You have control to fine-tune or adapt the workflow to your needs, no longer a “black box” (more didactic, therefore)
- Notebooks combine text, code and its execution result (e.g. figures) in a very convenient way (e.g. this presentation)
Dont’t worry!
- This is not a programming course
- You will not have to code in this lesson (hopefully on your own)
- I will already provide the R notebooks
- Just understand the steps, make little changes and run the notebook
2.2 R notebook example
---
title: "My first notebook"
output: html_notebook
---

# First section

The title above will be rendered with a bigger font and this text with normal font.

## Subsection

The following block is a code chunk in R that will be executed (when pressing
Ctrl+Shift+Enter) and its output included in this same document:

` ` `{r}
x <- 2
x+1
` ` `
3
2.3 R syntax
- We can make mathematical operations as usual:
3*4 + 2^3 - Often we want to save the result into a variable:
x <- 5/4or5/4 -> x - And use that variable later:
x * 3 - We can also use predefined functions:
min(3, 5, 2) - And pass parameters to them:
min(3, NA, 5, 2, na.rm = TRUE) - We can import third-party functions:
library(tidyverse)
- We can operate with different data types:
- numeric:
3.14 - character:
"E2F1"or'E2F1' - vector:
c(4, 6, 9) - logical:
TRUE,FALSE - Not Available:
NA - matrix, dataframe, tibble: data in rows and columns (with names)
- etc.
- numeric:
2.4 Tidyverse
- Will work with data (PSMs, peptides, proteins, etc.) organized in tibbles (≈dataframes):
- Like a spreadsheet, with rows (observations) and columns (variables)
- Tidyverse provides useful packages for data science:
- See R for Data Science for a great book (free)

Example
- Tibble with
targetanddecoycolumns and 5 rows:
# A tibble: 5 × 2
  decoy target
  <dbl>  <dbl>
1     0     10
2     0     20
3     1     30
4     1     40
5 2 50- Compute a new tibble with an additional
FDR=decoy/targetcolumn:
3 Working environment
3.1 Virtual machine
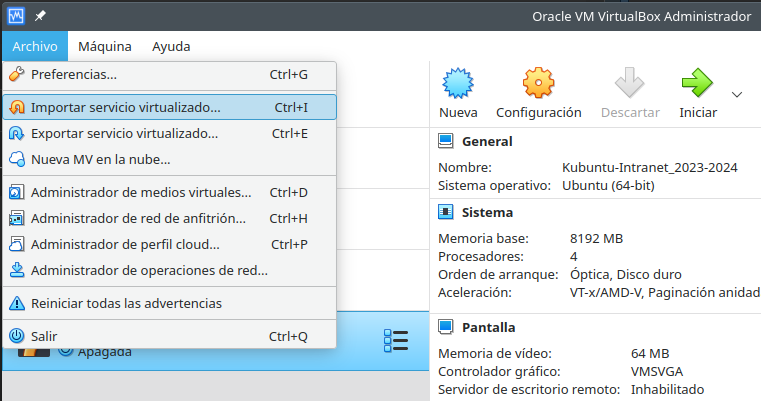
- Launch VirtualBox and import (~2 minutes) the downloaded file (
*.ova)

Configure the virtual machine hardware according to your available resources
Start the virtual machine and log-in using your LDAP credentials
3.2 R Studio
- Click on Projects/R/ProteomicsBiomedicine/R.Rproj to open the R Studio project provided
- Now you can open the latest version of the provided notebooks:
introduction.Rmd(this document)workflow_id.Rmd:
- Or even create a new notebook for practicing:
- New file/R Notebook


Proteomics in Biomedicine – ©2023-2025 Gorka Prieto Agujeta (UPV/EHU)
