CONDITION <- "ctrl"
REPLICATE <- "rep1"

psms <-
  # Load PSMs from mzIdentML files
  iwf_load_psms(
    path = paste("data", CONDITION, REPLICATE, sep = "/"), pattern = ".mzid",
    # We will use MS-GF+ spectral E-value for the target-decoy approach
    psm_score = "MS.GF.SpecEValue") %>%
  # Parse fasta headers
  parse_psms()

psms %>% glimpse()Step-by-step LC-MS/MS Identification Wokflow in R
Proteomics in Biomedicine
Gorka Prieto <gorka.prieto@ehu.eus>
University of the Basque Country (UPV/EHU)
September 29, 2025
1 Introduction
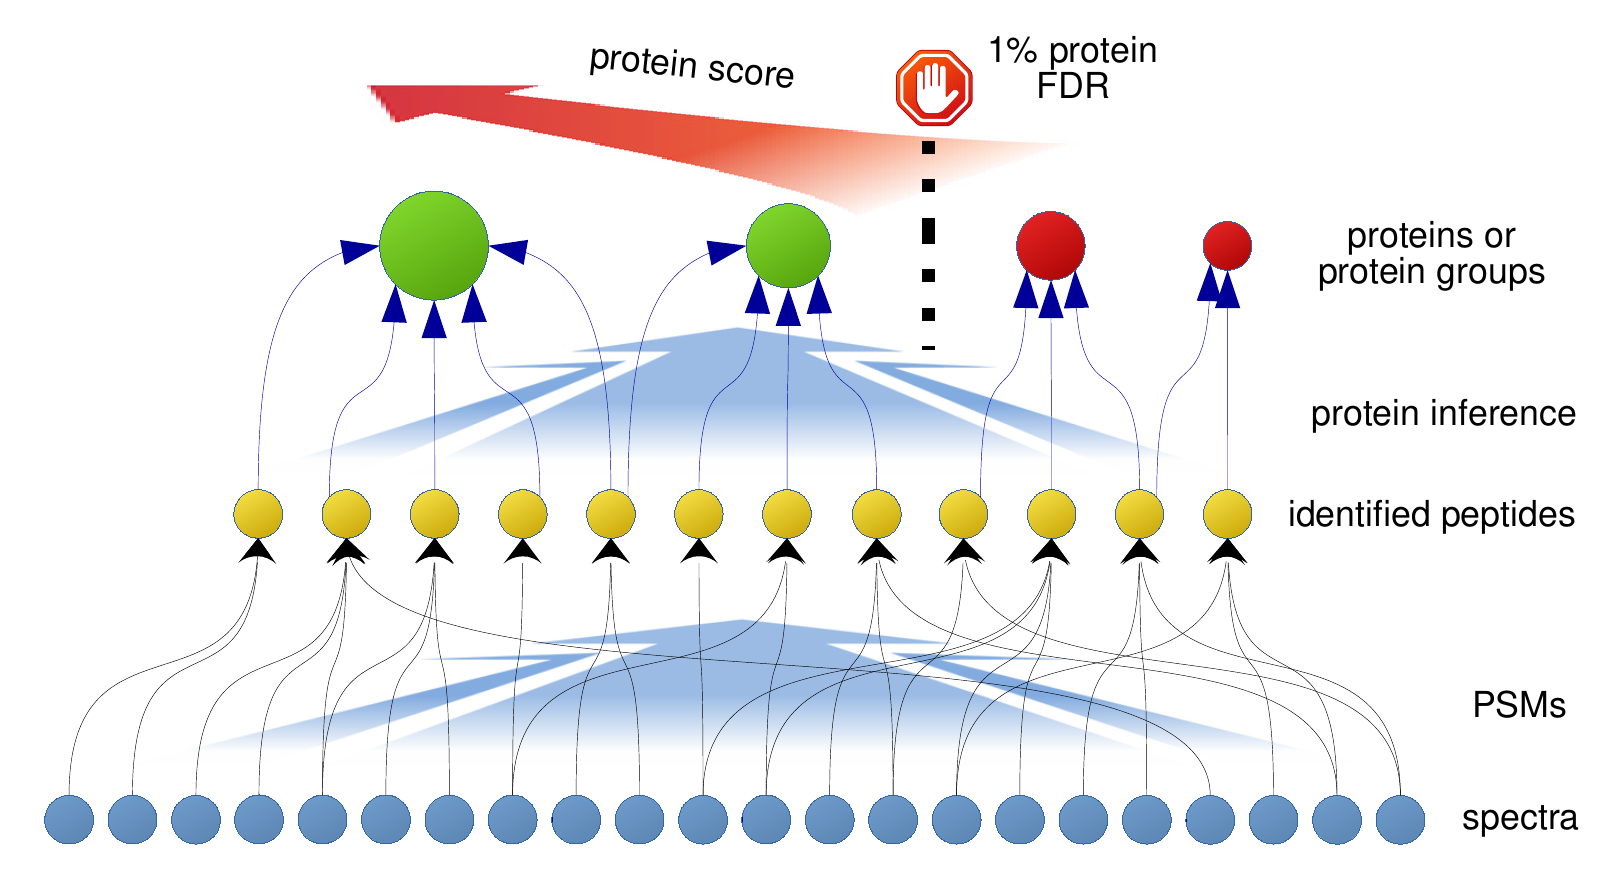
1.1 Outline

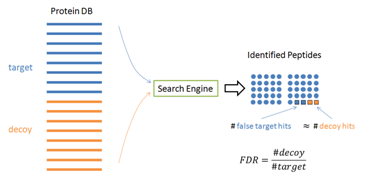
1.2 Target-decoy approach
- Many MS/MS spectrum matches are incorrect!! How to discriminate them?
- Manual inspection … of thousands?
- Using a statistical approach

- Commonly we use a decoy database:

1.3 Sample dataset
We will use the dataset from Ramirez et al. (2018):
Organism: Drosophila melanogaster (heads).
Two conditions: control and experimental (Ube3a over-expression).
Three replicates (biological) for each condition.
Four gel slices in each replicate.
Search results:
2 Peptide-spectrum matches (PSMs)
2.1 Loading PSMs from mzIdentML files
- Set
CONDITIONandREPLICATEvariables to the desired dataset. - We will use functions from the
b10protR package (Prieto 2024) and from the companionhelper.Rfile.
2.1 Loading PSMs from mzIdentML files
Rows: 343,768
Columns: 29
$ spectrumID               <chr> "index=2234", "index=2234", "index=2234", "in…
$ chargeState              <int> 2, 2, 2, 2, 2, 2, 2, 2, 2, 2, 2, 2, 2, 2, 2, …
$ rank                     <int> 1, 1, 1, 2, 2, 2, 2, 3, 3, 3, 4, 4, 4, 4, 5, …
$ passThreshold            <lgl> TRUE, TRUE, TRUE, TRUE, TRUE, TRUE, TRUE, TRU…
$ experimentalMassToCharge <dbl> 1052.482, 1052.482, 1052.482, 1052.482, 1052.…
$ calculatedMassToCharge   <dbl> 1052.484, 1052.484, 1052.484, 1052.486, 1052.…
$ sequence                 <chr> "GQTGGDVNVEMDAAPGVDLSR", "GQTGGDVNVEMDAAPGVDL…
$ peptideRef               <chr> "Pep_GQTGGDVNVEM+16DAAPGVDLSR", "Pep_GQTGGDVN…
$ modNum                   <int> 1, 1, 1, 1, 1, 1, 1, 1, 1, 1, 2, 2, 2, 2, 3, …
$ isDecoy                  <lgl> FALSE, FALSE, FALSE, TRUE, TRUE, TRUE, TRUE, …
$ post                     <chr> "I", "I", "I", "Y", "Y", "Y", "Y", "I", "I", …
$ pre                      <chr> "R", "R", "R", "K", "K", "K", "K", "R", "R", …
$ start                    <int> 264, 260, 260, 59, 59, 59, 59, 992, 992, 992,…
$ end                      <int> 284, 280, 280, 75, 75, 75, 75, 1009, 1009, 10…
$ DatabaseAccess           <chr> "P08779", "Q3ZAW8", "Q9Z2K1", "tr|Q9VUV4_REVE…
$ DBseqLength              <int> 473, 474, 469, 861, 851, 845, 701, 3843, 3842…
$ DatabaseSeq              <chr> "", "", "", "", "", "", "", "", "", "", "", "…
$ DatabaseDescription      <chr> "P08779 SWISS-PROT:P08779 Tax_Id=9606 GN=KRT1…
$ spectrum.title           <chr> "File: \"C:\\Users\\ProteomeDiscoverer\\Deskt…
$ scan.number.s.           <dbl> 5045, 5045, 5045, 5045, 5045, 5045, 5045, 504…
$ scan.start.time          <chr> "1278.0", "1278.0", "1278.0", "1278.0", "1278…
$ acquisitionNum           <dbl> 2234, 2234, 2234, 2234, 2234, 2234, 2234, 223…
$ MS.GF.RawScore           <dbl> 203, 203, 203, 31, 31, 31, 31, 25, 25, 25, 23…
$ MS.GF.DeNovoScore        <dbl> 204, 204, 204, 204, 204, 204, 204, 204, 204, …
$ MS.GF.SpecEValue         <dbl> 1.204841e-26, 1.204841e-26, 1.204841e-26, 2.3…
$ MS.GF.EValue             <dbl> 2.142592e-19, 2.142592e-19, 2.142592e-19, 4.0…
$ psmScore                 <dbl> 1.204841e-26, 1.204841e-26, 1.204841e-26, 2.3…
$ proteinRef               <chr> "P08779", "Q3ZAW8", "Q9Z2K1", "Q9VUV4_REVERSE…
$ geneRef                  <chr> "KRT16", "Krt16", "Krt16", "sff_REVERSED", "s…
2.2 Counting data
- How many spectra, peptides and PSMs are there?
2.3 Target-decoy competition
- We select the best PSM per spectrum (
rank=1) - How should have changed the counts? which should have more entries? and less?
| subset | psms | spectra | peptides |
|---|---|---|---|
| decoy | 4510 | 4261 | 3884 |
| target | 8934 | 8623 | 6392 |
| total | 13444 | 12447 | 10271 |
3 Peptide level
3.1 Peptide-level score
- Compute a simple peptide-level score using the score of the best PSM
- Remove peptide sequences present in both target and decoy databases
- Is the score useful to discriminate between target and decoy peptides?

3.2 Peptide-level FDR
- What’s the peptide-level global FDR without using any score threshold?
- Compute a peptide-level FDR using the peptide-level score
- How many peptides pass a 1% FDR threshold?
- Which is the corresponding score threshold?
# A tibble: 4 × 9
  peptideRef       pepScore isDecoy decoys targets    pval    LP     FDR    qval
  <chr>               <dbl> <lgl>    <int>   <int>   <dbl> <dbl>   <dbl>   <dbl>
1 Pep_VNQDANDKSPDK  4.75e-9 TRUE        22    2236 0.00554  2.26 0.00984 0.00983
2 Pep_HLKEDTLFK     4.76e-9 FALSE       22    2237 0.00580  2.24 0.00983 0.00983
3 Pep_QSK+114TK+1…  4.80e-9 FALSE       22    2238 0.00580  2.24 0.00983 0.00983
4 Pep_YREFENILR 4.84e-9 FALSE 22 2239 0.00580 2.24 0.00983 0.00983- Why do we use q-value for threshold instead of FDR?
4 Protein level
4.1 Peptide-to-protein relations
- First, we obtain the peptide-to-protein relations from the initial PSMs.
- Then, merge the peptide-level scores from the previous section:
4.1 Peptide-to-protein relations
Rows: 32,209
Columns: 11
$ peptideRef <chr> "Pep_AAAALFTR", "Pep_AAAALFTR", "Pep_AAAALFTR", "Pep_AAAART…
$ proteinRef <chr> "Q6NKM1_REVERSED", "Q960D5_REVERSED", "Q9VVA9_REVERSED", "Q…
$ shared     <int> 3, 3, 3, 2, 2, 2, 2, 5, 5, 5, 5, 5, 1, 2, 2, 1, 1, 5, 5, 5,…
$ pepScore   <dbl> 2.128236e-06, 2.128236e-06, 2.128236e-06, 9.431675e-05, 9.4…
$ isDecoy    <lgl> TRUE, TRUE, TRUE, TRUE, TRUE, TRUE, TRUE, TRUE, TRUE, TRUE,…
$ decoys     <int> 2383, 2383, 2383, 3735, 3735, 1538, 1538, 3588, 3588, 3588,…
$ targets    <int> 4777, 4777, 4777, 6227, 6227, 3949, 3949, 6074, 6074, 6074,…
$ pval       <dbl> 0.6142046919, 0.6142046919, 0.6142046919, 0.9627481310, 0.9…
$ LP         <dbl> 0.21168687, 0.21168687, 0.21168687, 0.01648732, 0.01648732,…
$ FDR        <dbl> 0.4988486, 0.4988486, 0.4988486, 0.5998073, 0.5998073, 0.38…
$ qval       <dbl> 0.4986399, 0.4986399, 0.4986399, 0.5998073, 0.5998073, 0.38…
4.2 Counting data
- How many proteins are potentially identified with a 1% peptide-level FDR?
- How will it be the protein-level FDR?
4.3 Dealing with ambiguities
- The same peptide can match different proteins
- How do these shared peptides affect the protein count?
- Now count the number of proteins identified only with unique (i.e. non-shared) peptides
pep2prot %>%
  filter(shared == 1, qval <= 0.01) %>% # Peptide-level filter
  group_by(proteinRef) %>%
  summarise(isDecoy = any(isDecoy)) %>%
global_fdr() # Protein-level FDR| Target | Decoy | Global FDR (%) |
|---|---|---|
| 153 | 6 | 3.921569 |
- Could we use shared peptides without inflating protein numbers?
4.4 Protein-level FDR
- For the moment we will use only unique peptides
- Steps:
- Calculate a protein-level score:
- See Prieto and Vázquez (2020)
- With this score calculate the protein-level FDR

- Steps (continuation):
- Filter by 1% protein-level FDR
| Target | Decoy | Global FDR (%) |
|---|---|---|
| 140 | 1 | 0.7142857 |
- But we have very small proteins counts because:
- We have removed shared peptides
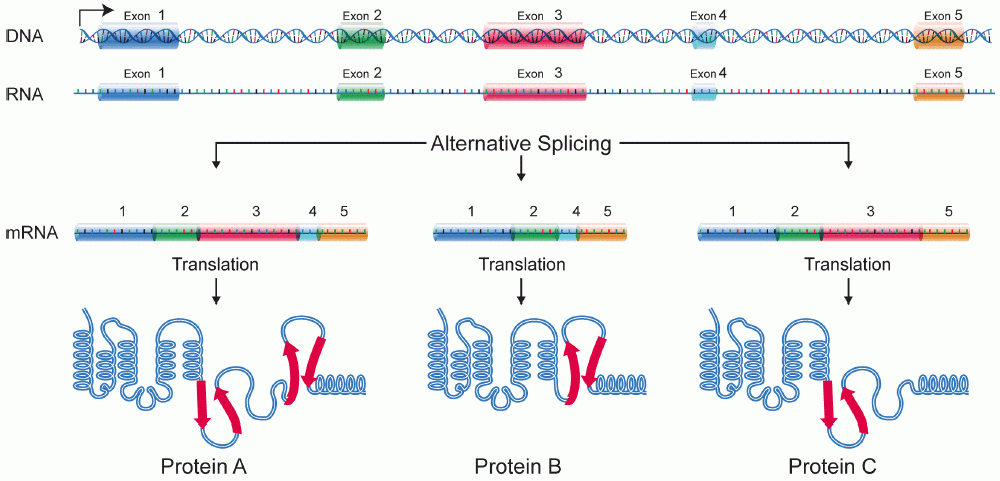
- There are many protein isoforms in the fasta database
- What could we do?
5 Gene level
- Using peptide-to-gene relations we could follow the same strategy used at protein-level
- Peptides only shared between protein isoforms within the same gene will be preserved

5.1 Peptide-to-gene relations
- Again, we obtain the peptide-to-gene relations from the initial PSMs and then merge the peptide-level scores:
5.1 Peptide-to-gene relations
Rows: 14,583
Columns: 11
$ peptideRef <chr> "Pep_AAAALFTR", "Pep_AAAALFTR", "Pep_AAAARTNK", "Pep_AAADEW…
$ geneRef    <chr> "CG9715_REVERSED", "NA_REVERSED", "CG6650_REVERSED", "Ssrp-…
$ shared     <int> 2, 2, 1, 2, 2, 1, 1, 1, 1, 1, 1, 2, 2, 2, 2, 2, 2, 2, 2, 1,…
$ pepScore   <dbl> 2.128236e-06, 2.128236e-06, 9.431675e-05, 8.691764e-07, 8.6…
$ isDecoy    <lgl> TRUE, TRUE, TRUE, TRUE, TRUE, TRUE, FALSE, FALSE, FALSE, TR…
$ decoys     <int> 2383, 2383, 3735, 1538, 1538, 3588, 0, 2462, 0, 1389, 3141,…
$ targets    <int> 4777, 4777, 6227, 3949, 3949, 6074, 110, 4862, 168, 3826, 5…
$ pval       <dbl> 0.6142046919, 0.6142046919, 0.9627481310, 0.3963650425, 0.3…
$ LP         <dbl> 0.211686870, 0.211686870, 0.016487316, 0.401904655, 0.40190…
$ FDR        <dbl> 0.4988486, 0.4988486, 0.5998073, 0.3894657, 0.3894657, 0.59…
$ qval       <dbl> 0.4986399, 0.4986399, 0.5998073, 0.3893246, 0.3893246, 0.59…
5.2 Counting data
- How many genes are potentially identified with a 1% peptide-level FDR?
- How will it be the gene-level FDR?
| Target | Decoy | Global FDR (%) |
|---|---|---|
| 867 | 28 | 3.229527 |
- And using only unique peptides?
5.3 Gene-level FDR
- Calculate a gene-level score
- With this score calculate the gene-level FDR

- Filter by 1% gene-level FDR
- We have increased the identifications, but enough?
6 Protein ambiguity groups
- Instead of using only unique peptides we can exploit shared peptides
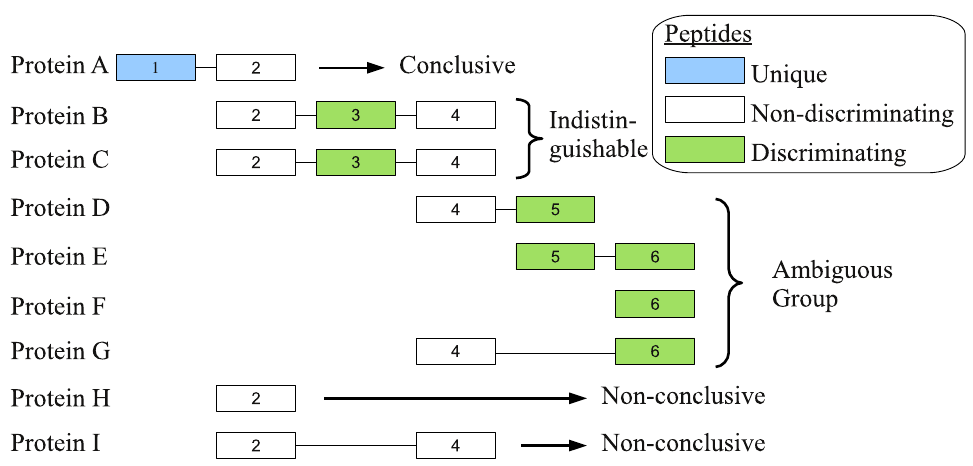
- PAnalyzer tool from Prieto et al. (2012):

6.1 Peptide-to-group relations
- We let PAnalyzer transform peptide-to-protein relations into peptide-to-protein-to-group relations:
- Display an
indistinguishablegroup:

- Display an
ambiguousgroup:

6.2 Protein group-level FDR
- Calculate a protein group-level score
- With this score calculate the protein group-level FDR
scored_groups <-
  pep2prot2group %>%
  # Instead of iwf_pep2level() we use iwf_pep2group() to retain the list of proteins within each group
  iwf_pep2group() %>%
  # Only consider peptides unique to one group (this also removes non-conclusive proteins)
  filter(shared==1) %>%
  # Calculate protein group-level scores
  lpg(groupRef) %>%
  # Calculate target-decoy approach metrics using the LPGF score
  target_decoy_approach(LPGF, lower_better = FALSE)
- Filter by 1% protein group-level FDR
7 Exercises
7.1 Use another dataset
- Another replicate from the same condition:
"data/ctrl/rep1""data/ctrl/rep2","data/ctrl/rep3"
- A replicate from another condition:
"data/exp/rep1","data/exp/rep2","data/exp/rep3"
- What is the minimum number of protein groups using a 1% protein-group-level FDR?
- Save identified genes to a local
xlsxfile by executing:
7.2 Compare the identifications
From your colleages obtain the
xlsxfiles with the identifications for the remaining replicates and conditions.Combine the results into a
comparison.xlsxby executing:
list.files(pattern = "genes_.*xlsx") %>%
  map(read_excel) %>%
  bind_rows() %>%
  pivot_wider(names_from = c(condition, replicate), values_from = LPGF) %>%
  rowwise() %>%
  mutate(num_ctrl = sum(!is.na(across(starts_with("ctrl"))))) %>%
  mutate(num_exp = sum(!is.na(across(starts_with("exp"))))) %>%
write_xlsx("comparison.xlsx")- Open
comparison.xlsxwith LibreOffice:- Which genes are reported in at least two replicates of the experimental condition and no replicates in the control condition?
7.3 Test
- Answer the questions in eGela:
- 1..3: theoretical
- 4..7: results for your dataset
- 8..10: comparison between datasets

References
Elias, Joshua E., and Steven P. Gygi. 2007. “Target-Decoy Search Strategy for Increased Confidence in Large-Scale Protein Identifications by Mass Spectrometry.” Nature Methods 4 (3): 207–14. https://doi.org/10.1038/nmeth1019.
Käll, Lukas, John D. Storey, Michael J. MacCoss, and William Stafford Noble. 2008. “Assigning Significance to Peptides Identified by Tandem Mass Spectrometry Using Decoy Databases.” Journal of Proteome Research 7 (1): 29–34. https://doi.org/10.1021/pr700600n.
Prieto, Gorka. 2024. B10prot: Protein Identification for Shotgun Proteomics Data. https://akrogp.github.io/b10prot/.
Prieto, Gorka, Kerman Aloria, Nerea Osinalde, Asier Fullaondo, Jesus M. Arizmendi, and Rune Matthiesen. 2012. “PAnalyzer: A Software Tool for Protein Inference in Shotgun Proteomics.” BMC Bioinformatics 13 (1): 288. https://doi.org/10.1186/1471-2105-13-288.
Prieto, Gorka, and Jesús Vázquez. 2020. “Protein Probability Model for High-Throughput Protein Identification by Mass Spectrometry-Based Proteomics.” Journal of Proteome Research 19 (3): 1285–97. https://doi.org/10.1021/acs.jproteome.9b00819.
Ramirez, Juanma, Benoit Lectez, Nerea Osinalde, Monika Sivá, Nagore Elu, Kerman Aloria, Michaela Procházková, et al. 2018. “Quantitative proteomics reveals neuronal ubiquitination of Rngo/Ddi1 and several proteasomal subunits by Ube3a, accounting for the complexity of Angelman syndrome.” Human Molecular Genetics 27 (11): 1955–71. https://doi.org/10.1093/hmg/ddy103.
